One of the encouraging takeaways from the Indian housing market’s Q3 performance has been the strides made in Pune. The city outperformed several other metropolitans in terms of registered sales value. In a recent Inspector General of Registration (IGR) data study, Square Yards observed a 19% Y-o-Y increase in Pune’s registered home sales. This translates to an estimated ₹13,865 crore worth of housing sales for 2024’s July to September quarter. The average sales value has also shot up by a 20% year-on-year rise, reaching a record high of ₹74 lakhs.
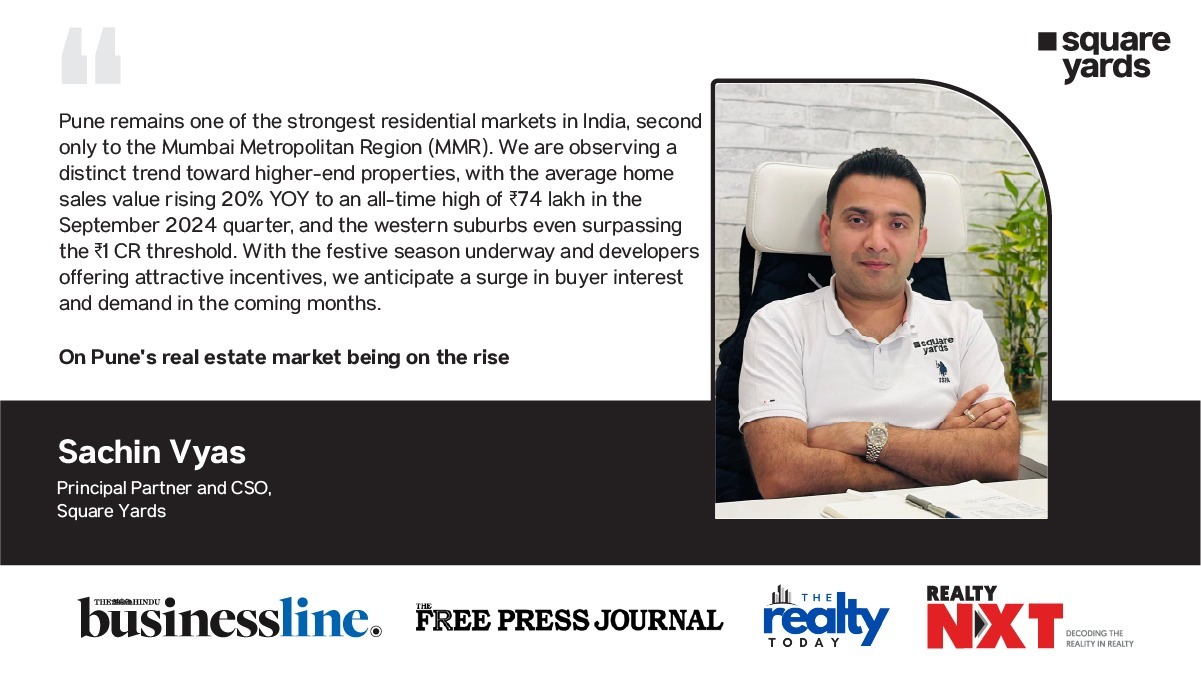
Sachin Vyas, Principal Partner & CSO at Square Yards, observed, “Pune remains one of the strongest residential markets in India, second only to Mumbai MMR. We are observing a distinct trend toward higher-end properties, with the average home sales value rising 20% year-on-year to an all-time high of ₹74 lakhs in the September 2024 quarter and the Western Suburbs surpassing the one crore threshold. Currently, Pimpri-Chinchwad and the Western Suburbs are at the forefront of residential activity in Pune, driven by excellent connectivity and their strategic location near IT hubs.”
Housing sales in Pune during the same period last year amounted to ₹11,626 crore. The current growth, however, is accompanied by a marginal 1% decline in the number of registered transactions for the same duration. Here is a quick summary of the city’s housing market based on the IGR data:
| Pune Residential Market Overview 2024 | |||||
| Particular | April – June 2024 (Q2) | July – September 2024 (Q3) | July – September 2023 | Q-o-Q Growth | Y-o-Y Growth |
| Registered Residential Transactions | 20,190 | 18,806 | 18,907 | -7% | -1% |
| Registered Home Sales Value (GTV) (Rs.) | 13,995 crore | 13,865 crore | 11,626 crore | -1% | 19% |
| Average Registered Sales Value (Rs.) | 69 lakhs | 74 lakhs | 61 lakhs | 6% | 20% |
Pune’s Top Performers
Pimpri-Chinchwad, Western, and Eastern suburbs emerged as Pune’s best-performing areas. Together, they accounted for 84% of the city’s total registered home sales in Q3 2024. Pimpri-Chinchwad, the best of all three micro markets, contributed 34% to the total sales value and 46% of the residential transactions. Western and Eastern Suburbs collectively accounted for a 38% share in the total sales value. Rising IT activity and proximity to the Mumbai-Pune expressway and NH-48 are key factors behind the robust growth in these areas.
Pune-based Kolte Patil Developers led in terms of sales value and registered transactions in the July-September quarter. Life Republic, their coveted integrated township in Hinjewadi, recorded the highest registered transactions and third-highest sales value. Pristine Properties’ O2 World Project in Kharadi also contributed significantly to the city’s transaction volume. Improving on last year’s performance, Mahindra Lifespaces also made it to the list with contributions from the Codename Crown project in Pimple Nilakh.
| S.No. | Top Developers (Registered Home Sales Value in July-September 2024) | Best Performing Project | Value (Rs.) |
| 1. | Kolte Patil Developers | Life Republic | 425 crore |
| 2. | Pristine Properties | O2 World Project | 312 crore |
| 3. | Mahindra Lifespaces | Codename Crown | 305 crore |
| 4. | Lodha Group | Lodha Giardino | 217 crore |
| 5. | VTP Realty | VTP Dolce Vita | 202 crore |
| S.No. | Top Developers (Registered Residential Transactions in July-September 2024) | Best Performing Projects | No. of Units Sold |
| 1. | Kolte Patil Developers | Life Republic | 430 |
| 2. | Pristine Properties | Pristine O2 | 314 |
| 3. | Mahindra Lifespaces | Codename Crown | 304 |
| 4. | VTP Realty | VTP Dolce Vita | 224 |
| 5. | Kumar Properties | Kumar Primeview | 206 |
Segment Wise Breakdown
The July-September quarter also witnessed a significant surge in the premium housing segment. Properties priced above ₹1 crore recorded a robust 18% rise, surpassing the 13% growth during the same period last year. Of these, the sale of houses priced between ₹1 and ₹2 crores saw a maximum increase of 15%, indicating a promising potential for high returns.
Pune also noted interesting developments in buyers’ preferred configurations. While 500 to 1,000 sq. ft. remains the sweet spot, with a 62% share in all registered transactions, the demand for larger properties has significantly increased. The market share of properties between 1,000 sq. ft. and 1,500 sq. ft. has risen to 11% from the previous 8%, reflecting the evolving market dynamics.
Unlike these segments, lower-to-mid-priced properties witnessed a shift in market trends. Homes costing less than ₹50 lakhs and between ₹50 lakh and ₹1 crore occupied an 87% share during the same period last year. Currently, they make up for a lesser 82% share in the market, indicating a shift in buyer preferences.
Expecting a continued phase of positive developments, Sumit Vyas added, “..Looking ahead, we are very optimistic about the market’s potential. With the festive season underway and developers offering attractive incentives, we anticipate a surge in buyer interest and demand in the coming months.”
Read more through the links below to uncover the key trends and market leaders driving this growth:
The Hindu Business Line – https://bit.ly/3O30pQV
Realty NXT – https://bit.ly/3UoI0kM
The Realty Today – https://bit.ly/4e2R3iu
Realty & More – https://bit.ly/3BXW5Q6
Free Press Journal – https://bit.ly/4fhNupF
Published Date: 23 Oct, 2024


