- Home
- Property in Chandigarh
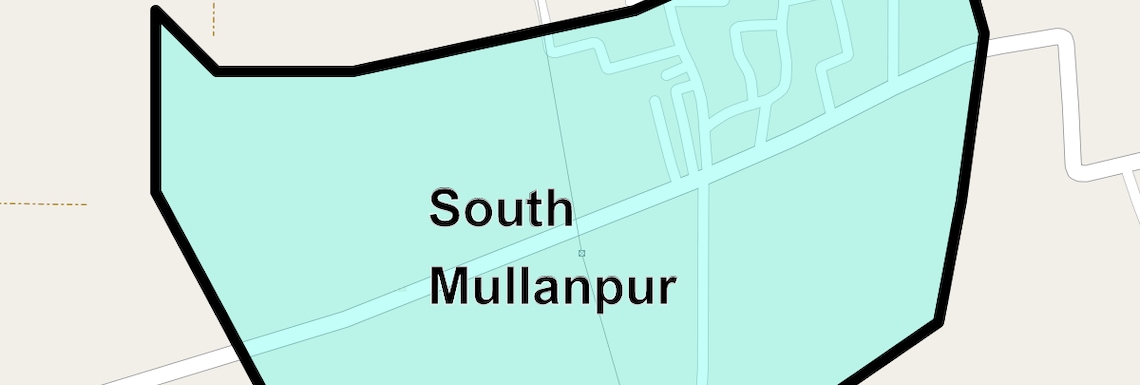
- Property in South Mullanpur, Chandigarh
- South Mullanpur
South Mullanpur, Chandigarh
Mullanpur, 140103
View on Map
- Average Sale Price ₹ 7,550/Sq. Ft.
Check Travel Time from South Mullanpur to Major Areas in Chandigarh
Please Select the Starting Point to calculate the travel time
Price Rates & Insights for South Mullanpur, Chandigarh
Comprehensive assessment of your property's current worth in the current market
Get Valuation Report
Property Demand & Supply in South Mullanpur, Chandigarh
Properties for Sale in South Mullanpur, Chandigarh
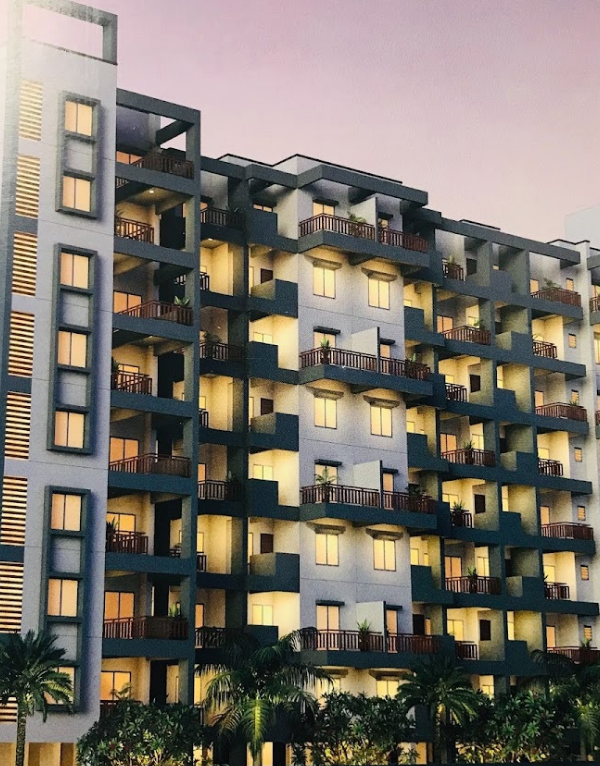
Flats in South Mullanpur Chandigarh
for Sale
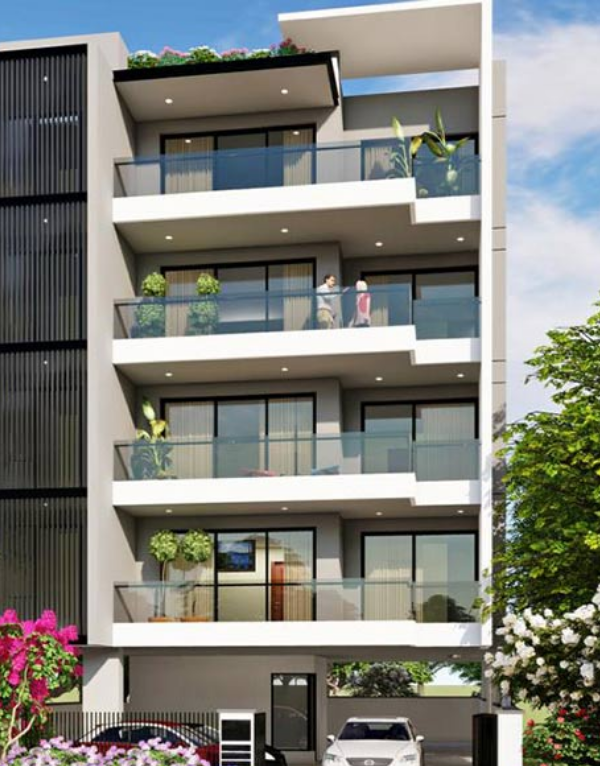
Builder Floors in South Mullanpur Chandigarh
for Sale
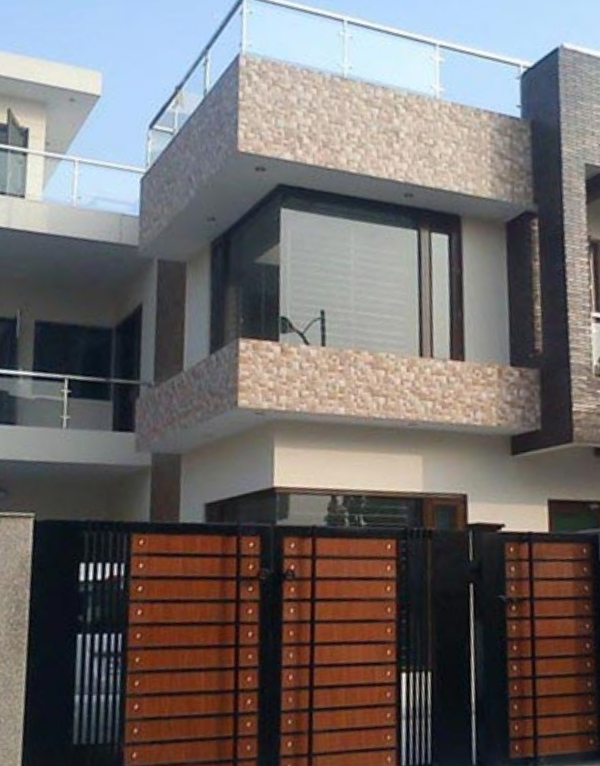
Independent Houses in South Mullanpur Chandigarh
for Sale
Residential Plots in South Mullanpur Chandigarh
for Sale

Shops in South Mullanpur Chandigarh
for Sale
2 BHK Flats
in South Mullanpur Chandigarh for Sale
3 BHK Flats
in South Mullanpur Chandigarh for Sale
4 BHK Flats
in South Mullanpur Chandigarh for Sale
Properties for Rent in South Mullanpur, Chandigarh
Flats in South Mullanpur Chandigarh
for Rent
Builder Floors in South Mullanpur Chandigarh
for Rent
Independent Houses in South Mullanpur Chandigarh
for Rent
Villas in South Mullanpur Chandigarh
for Rent

Shops in South Mullanpur Chandigarh
for Rent
2 BHK Flats
in South Mullanpur Chandigarh for Rent
3 BHK Flats
in South Mullanpur Chandigarh for Rent
4 BHK Flats
in South Mullanpur Chandigarh for Rent
Explore Localities Nearby South Mullanpur, Chandigarh
- Average Sale Price₹ 9,200 /Sq. Ft


- Average Sale Price₹ 5,350 /Sq. Ft


- Average Sale Price₹ 4,950 /Sq. Ft
Top Builders in South Mullanpur, Chandigarh